Forgotten Fundamentals of the Energy Crisis - Part 8
by Prof. Al Bartlett
VIII. A word of caution
We must note that these calculations of the EET of fossil fuels are not predictions of the future. They simply give us first-order estimates of the life expectancies of known quantities of several fuels under the conditions of steady growth which our society and our government hold sacred. These estimates are emphasized as aids to understanding the consequences of any particular growth scenario that the reader may want to consider or to evaluate.
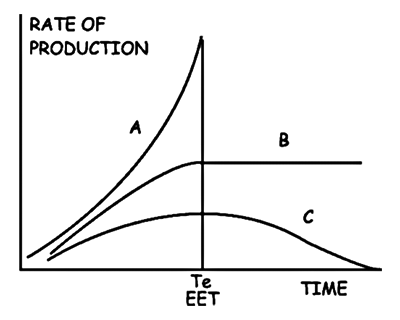
The rate of production of our mineral resources will not rise exponentially until the EET is reached and then plunge abruptly to zero, as modeled in these calculations and as shown in curve A of Fig. 5 even though our national goals are predicated on uninterrupted growth. The rate of production of our nonrenewable mineral resources will not follow the classical S-shaped transition from an early period of exponential growth to a horizontal curve representing a constant rate of production, curve B. Such a curve can be achieved in the production of renewable resources such as food, forest products, or the production of solar energy, provided the rate of production of the renewable resource is not dependent on fossil fuels. Reference has already been made to the dependence of modern agriculture on petroleum, and as long as this dependence continues, the curve of agricultural production would be expected to follow curve C, (the curve for nonrenewable petroleum) rather than curve B. Although the rate of production of mineral resources has been growing exponentially, one knows that at some time in the future the resource will be exhausted and the rate of production will return to zero. The past history, this one future datum and a careful study of the rate versus time of production of resources that have expired has led Dr. M. King Hubbert to the conclusion that the rate of production of a nonrenewable resource will rise and fall in the symmetrical manner of a Gaussian error curve as shown in curve C of Fig. 5. When he fits the data for U.S. oil production in the lower 48 states to a curve such as C, Hubbert finds that we are now just to the right of the peak. We have used one-half of the recoverable petroleum that was ever in the ground in the U.S. and in the future the rate of production can only go downhill. However, our national demand for petroleum has continued to grow exponentially and the difference between our demands and our production has been made up by imports. Bold initiatives by the Congress could temporarily reverse the trend and could put a small bump on the downhill side of the curve. Alaskan oil can put a little bump on the downhill side of the curve. The downhill trend on the right side of the curve was noted clearly by Deputy Energy Secretary John O'Leary under the headline, "U.S. Energy - Disaster Inevitable by 1985,"34

Figure 5. Three patterns of growth. Curve A represents steady exponential growth in the rate of production of a non-renewable resource until the resource is exhausted at Te, the exponential expiration time (EET). The area under the curve from the present (t = 0) to t = Te is equal to the known size of the resource. Curve C represents Hubbert's model of the way in which the rate of production of a nonrenewable resource rises and falls. This model is based on studies of the rate of use of resources which have been nearly completely consumed. The area under the curve from the present to t = infinity is equal to the size of the resource.. Curve B represents the rate of production of a renewable resource such as agricultural or forest products, where a constant steady-state production can be maintained for long periods of time provided this production is not dependent on the use of a nonrenewable resource (such as petroleum) whose production is following a curve such as C.
Although U.S. oil and gas production hit their peak several years ago and are declining by about 8 percent per year, O'Leary said, the nation has avoided serious problems by using more foreign oil...We are walking into a disaster in the next three or four years with our eyes wide open.
The most dramatic conclusion that Hubbert draws from his curve for the complete cycle of U.S. oil production is that the consumption of the central 80% of the resource will take place in only 67 yrs.!
It is very sobering to face the downhill side of the curve and to note that in the past the rise in our annual per capita consumption of energy has gone hand-in-hand with the increase of our standard of living. It is more sobering to note the close coupling between our production of food and our use of petroleum. It is even more sobering to note that on March 7, 1956 (over 22 years ago) Dr. Hubbert, addressing the conference in San Antonio, Texas, of a large group of petroleum engineers and geologists said:
According to the best currently available information, the production of petroleum and natural gas on a world scale will probably pass its climax within the order of half a century, while for both the United States and for Texas, the peaks of production can be expected to occur within the next 10 or 15 years. (i.e., between 1966 and 1971)
Pazik tells33 of the shock this statement and the related analysis caused in oil industry circles and he tells about the efforts that were made by the "experts" to ignore this and the other results of the analysis made by Hubbert.
In order to use copyrighted material from this site for purposes of your own that go beyond 'fair use', you must obtain permission from the copyright owner.
