Forgotten Fundamentals of the Energy Crisis - Part 6
by Prof. Al Bartlett
VI. How long will our fossil fuels last?
The question of how long our resources will last is perhaps the most important question that can be asked in a modern industrial society. Dr. M. King Hubbert, a geophysicist now retired from the United States Geological Survey, is a world authority on the estimation of energy resources and on the prediction of their patterns of discovery and depletion. Many of the data used here come from Hubbert's papers.7-10 Several of the figures in this paper are redrawn from figures in his papers. These papers are required reading for anyone who wishes to understand the fundamentals and many of the details of the problem.
|
Table IV. |
|
|
Ultimate total production (Ref. 7) |
190 |
|
Produced to 1972 |
96.6 |
|
Percent of ultimate total production produced to 1972 (Ref.7) |
50.8% |
|
Annual production rate 1970 |
3.29 |
|
Units are 109 barrels (1 barrel = 42 U.S. gal. = 158.98 L). |
|
Let us examine the situation in regard to production of domestic crude oil in the U.S. Table IV gives the relevant data. Note that since one-half of our domestic petroleum has already been consumed, the "petroleum time" in the U.S. is 1 minute before noon! Figure 1 shows the historical trend in domestic production (consumption) of crude oil. Note that from 1870 to about 1930 the rate of production of domestic crude oil increased exponentially at a rate of 8.27% / yr with a doubling time of 8.4 yr. If the growth in the rate of production stopped and the rate of production was held constant at the 1970 rate, the remaining U.S. oil would last only (190 - 96.6) / 3.29 = 28 yr!

Figure 4. History of U.S. crude oil production (semilogarithmic scale). Redrawn from Hubbert's Figure 12, Reference 7.
We are currently importing one-half of the petroleum we use. If these imports were completely cut off and if there was no growth in the rate of domestic consumption above the 1970 rate, our domestic petroleum reserves would last only 14 yr! The vast shale oil deposits of Colorado and Wyoming represent an enormous resource. Hubbert reports that the oil recoverable under 1965 techniques is 80 x 109 barrels, and he quotes other higher estimates. In the preparation of Table V, the figure 103.4 x 10⁹ barrels was used as the estimate of U.S. shale oil so that the reserves used in the calculation of column 4 would be twice those that were used in the calculation of column 3. This table makes it clear that when consumption is rising exponentially, a doubling of the remaining resource results in only a small increase in the life expectancy of the resource.
A reporter from CBS News, speaking about oil shale on a three-hour television special feature on energy (August 31, 1977) said, "Most experts estimate that oil shale deposits like these near Rifle, Colorado, could provide more than a 100-yr supply." This statement should be compared with the figures given in column 4 of Table V. This comparison will serve to introduce the reader to the disturbing divergence between reassuring statements by authoritative sources and the results of simple calculations.
Anyone who wishes to talk about energy self-sufficiency for the United States (Project Independence) must understand Table V and the simple exponential calculations upon which it is based.
|
Table V. |
|||
|
Col.1 (%) |
Col.2 (yr) |
Col.3 (yr) |
Col.4 (yr) |
|
Percent annual growth rate |
Lifetime (EET) of the resource which is calculated using R = 190 - 96.6 = 93.4 as the estimated oil remaining in the lower 48 states. |
Lifetime (EET) calculated using R = 93.4 + 10 to include the Alaskan oil. |
Lifetime (EET) calculated using R = 93.4 + 10 + 103.4 = 206.8 to include Alaskan oil and a hypothetical estimate of U.S. oil shale. |
|
Zero |
28.4 |
31.4 |
62.8 |
|
1% |
25.0 |
27.3 |
48.8 |
|
2% |
22.5 |
24.4 |
40.7 |
|
3% |
20.5 |
22.1 |
35.3 |
|
4% |
19.0 |
20.4 |
31.4 |
|
5% |
17.7 |
18.9 |
28.4 |
|
6% |
16.6 |
17.7 |
26.0 |
|
7% |
15.6 |
16.6 |
24.1 |
|
8% |
14.8 |
15.7 |
22.4 |
|
9% |
14.1 |
14.9 |
21.1 |
|
10% |
13.4 |
14.2 |
19.9 |

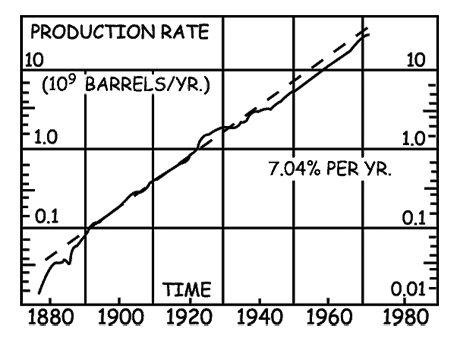
Fig. 2. History of world crudeoil production
(semilogarithmic scale). Redrawn from Hubbert's Figure 6, Reference 7.
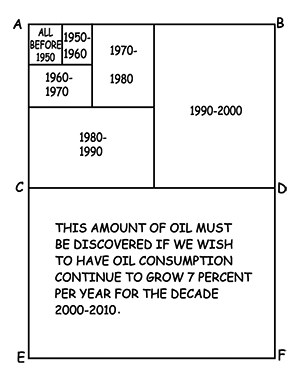
Table VI gives statistics on world production of crude oil. Figure 2 shows the historical trend in world crude oil production. Note that from 1890 to 1970 the production grew at a rate of 7.04% / yr, with a doubling time of 9.8 yr. It is easy to calculate that the world reserves of crude oil would last 101 yr if the growth in annual production was halted and production in the future was held constant at the 1970 level. Table VII shows the life expectancy (EET) of world crude oil reserves for various rates of growth of production and shows the amount by which the life expectancy is extended if one adds world deposits of oil shale. Column 4 is based on the assumption that the available shale oil is four times as large as the value reported by Hubbert. Note again that the effect of this very large hypothetical increase in the resource is very small. Figure 3 shows a dramatic graphical model from Mario Iona that can be used to represent this growth.11 When consumption grows 7% / yr the consumption in any decade is approximately equal to the sum of all previous consumption as can be seen by the areas representing consumption in successive decades. The rectangle ABDC represents all the known oil, including all that has been used in the past, and the rectangle CDFE represents the new discoveries that must be made if we wish the 7% / year growth to continue one decade, from the year 2000 to 2010!
|
Table VI. |
|
|
Ultimate total production (Ref.7) |
1952 |
|
Produced to 1972 |
261 |
|
Percent of total production produced to 1972 (Ref. 7) |
13.4% |
|
Annual Production rate 1970 |
16.7 |
|
Units are 109 barrels. Note that a little more than 1/8 of the world's oil has been consumed. The "world petroleum time" is between 2 and 3 min before noon, i.e. we are between 2 and 3 doubling times from the expiration of the resource. |
|
From these calculations we can draw a general conclusion of great importance. When we are dealing with exponential growth we do not need to have an accurate estimate of the size of a resource in order to make a reliable estimate of how long the resource will last.

Figure 3. This graphical model from Mario Iona can be used to represent this growth.11
When consumption grows 7% / yr the consumption in any decade is approximately equal to the sum of all previous consumption as can be seen by the areas representing consumption in successive decades.
The rectangle ABDC represents all the known oil, including all that has been used in the past, and the rectangle CDFE represents the new discoveries that must be made if we wish the 7% / year growth to continue one decade, from the year 2000 to 2010!
|
Table VII.
|
|||
|
Col. 1 (%) |
Col. 2 (yr) |
Col. 3 (yr) |
Col. 4 (yr) |
|
Percent annual growth rate of production |
Lifetime (EET) of the resource calculated using r = 1691 as the estimate of the amount of the remaining oil. |
Lifetime (EET) calculated using R = 1691 + 190 = 1881 representing crude oil plus oil shale. |
Lifetime (EET) calculated using R = 1691 + 4(190) = 2451 which assumes that the amount of shale oil is 4 times the amount which is known now. |
|
Zero |
101.0 |
113.0 |
147.0 |
|
1% |
69.9 |
75.4 |
90.3 |
|
2% |
55.3 |
59.0 |
68.5 |
|
3% |
46.5 |
49.2 |
56.2 |
|
4% |
40.5 |
42.6 |
48.2 |
|
5% |
36.0 |
37.8 |
42.4 |
|
6% |
32.6 |
34.1 |
38.0 |
|
7% |
29.8 |
31.2 |
34.6 |
|
8% |
27.6 |
28.8 |
31.8 |
|
9% |
25.7 |
26.8 |
29.5 |
|
10% |
24.1 |
25.1 |
27.5 |
A friend recently tried to reassure me by asserting that there remained undiscovered under our country at least as much oil as all we have ever used. Since it has been about 120 yr since the first discovery of oil in this country, he was sure that the undiscovered oil would be sufficient for another 120 yr. I had no success in convincing him that if such oil was found it would be sufficient only for one doubling time or about a decade.
As the reader ponders the seriousness of the situation and asks, "What will life be like without petroleum?" the thought arises of heating homes electrically or with solar power and of traveling in electric cars. A far more fundamental problem becomes apparent when one recognizes that modern agriculture is based on petroleum-powered machinery and on petroleum-based fertilizers. This is reflected in a definition of modern agriculture: "Modern agriculture is the use of land to convert petroleum into food."
Item: We have now reached the point in U.S. agriculture where we use 80 gallons of gasoline or its equivalent to raise an acre of corn, but only nine hours of human labor per crop acre for the average of all types of produce.12
Think for a moment of the effect of petroleum on American life. Petroleum has made it possible for American farms to be operated by only a tiny fraction of our population; only 1 American in 26 lived on a farm in 1976. The people thus displaced from our farms by petroleum-based mechanization have migrated to the cities where our ways of life are critically dependent on petroleum. The farms without the large number of people to do the work are also critically dependent on petroleum-based mechanization. The approaching exhaustion of the domestic reserves of petroleum and the rapid depletion of world reserves will have a profound effect on Americans in the cities and on the farms. It is clear that agriculture as we know it will experience major changes within the life expectancy of most of us, and with these changes could come a major further deterioration of world-wide levels of nutrition. The doubling time (36-42 yr) of world population (depending on whether the annual growth rate is 1.9% or 1.64%) means that we have this period of time in which we must double world food production if we wish to do no better than hold constant the fraction of the world population that is starving. This would mean that the number starving at the end of the doubling time would be twice the number that are starving today. This was put into bold relief by David Pimentel of Cornell University in an invited paper at the 1977 annual meeting of AAPT-APS (Chicago, 1977):
As a result of overpopulation and resource limitations, the world is fast losing its capacity to feed itself... More alarming is the fact that while the world population doubled its numbers in about 30 years the world doubled its energy consumption within the past decade. Moreover, the use of energy in food production has been increasing faster than its use in many other sectors of the economy.
It is possible to calculate an absolute upper limit to the amount of crude oil the earth could contain. We simply assert that the volume of petroleum in the earth cannot be larger than the volume of the earth. The volume of the earth is 6.81 x 10²¹ barrels, which would last for 4.1 x 10¹¹ yr if the 1970 rate of consumption of oil held constant with no growth. The use of Eq. (6) shows that if the rate of consumption of petroleum continued on the growth curve of 7.04% / yr of Fig. 2, this earth full of oil will last only 342 yr!
It has frequently been suggested that coal will answer the U.S. and world energy needs for a long period in the future. What are the facts?
|
Table VIII. |
|
|
Ultimate total production (Ref. 7) |
|
|
High estimate |
1486 |
|
Low estimate |
390 |
|
Produced through 1972 (My estimate from Hubbert's Fig. 22) |
50 |
|
Percent of ultimate production produced through 1972 |
|
|
Percent of high estimate |
3% |
|
Percent of low estimate |
13% |
|
Coal resource remaining
|
|
|
High estimate |
1436 |
|
Low estimate |
340 |
|
Annual production rate, 1972 |
0.5 |
|
Rate of export of coal, 1974 |
0.06 |
|
Annual production rate, 1974 |
0.6 |
|
Annual production rate, 1976 |
0.665 |
|
Units are 1,000,000,000 metric tons. |
|
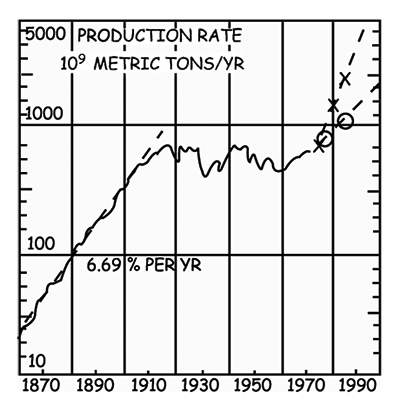
Table VIII shows data on U.S. coal production that are taken from several sources. Figure 4 shows the history of coal production in the U.S. Note that from 1860 to 1910, U.S. coal production grew exponentially at 6.69% / yr (T2 = 10.4 yr). The production then leveled off at 0.5 x 10⁹ tons / yr which held approximately constant until 1972 whereupon the rate started to rise steadily. Coal consumption remained level for 60 yr because our growing energy demands were met by petroleum and natural gas. In early 1976 the annual coal production goals of the U.S. government were 1.3 billion tons for 1980 and 2.1 billion tons for 1985. The 1976 production is now reported to have been 0.665 billion tons and the current goal is to raise annual production to a billion tons by 1985.13 From these data we can see that the Ford administration's goals called for coal production to increase on the order of 10% / yr while the Carter administration is speaking of growth of production of approximately 5% / yr.

Figure 4. History of U.S. coal production (semilogarithmic scale). Redrawn from Hubbert's Fig. 10, Ref. 7. In the upper right, the crosses in the steep dashed curve show the coal production goals of the Ford Administration, and the circles in the lower dashed curve show the production goals of the Carter Administration. From the close of the American Civil War to about the year 1910, coal production grew at a steady rate of 6.69% / yr. If this growth rate had continued undiminished after 1910, the small estimate of the size of U.S. coal reserves would have been consumed by about 1967 and the larger estimate of the size of the reserves would have been consumed by about the year 1990!
Table IX shows the expiration times (EET) of the high and the low estimates of U.S. coal reserves for various rates of increase of the rate of production as calculated from the equation for the EET [Eq. (6)]. If we use the conservative smaller estimate of U.S. coal reserves we see that the growth of the rate of consumption will have to be held below 3% / yr if we want coal to last until our nation's tricentennial. If we want coal to last 200 years, the rate of growth of annual consumption will have to be held below 1% / yr!
One obtains an interesting insight into the problem if one asks how long beyond the year 1910 could coal production have continued on the curve of exponential growth at the historic rate of 6.69% / yr of Fig. 4. The smaller estimate of U.S. coal would have been consumed around the year 1967 and the large estimate would have expired around the year 1990. Thus it is clear that the use of coal as an energy source in 1978 and in the years to come is possible only because the growth in the annual production of coal was zero from 1910 to about 1972!
In order to use copyrighted material from this site for purposes of your own that go beyond 'fair use', you must obtain permission from the copyright owner.
